Copyright © 1995-2001 MZA Associates Corporation

Anchoring WaveTrain to ACS
Extended Objects
We recently completed the our second anchoring exercise for WaveTrain, anchoring it to ACS for modeling extended incoherent sources using multiple random speckle realizations. We also verified that WaveTrain correctly models the radiometrics; for this purpose we compared WaveTrain results directly with theory, using the total received energy at the focal plane. Don Link of SAIC provided us with the ACS input files we needed. He also performed the runs, but we re-ran them after modifying the input file to make comparison easier.
The simulation parameters were similar to those used in our DPE anchoring exercise, except that we replaced the two point sources with a single uniformly illuminated disk, and imaged it on a focal plane. The parameters are described in Table 1.
|
Aperture Diameter, D |
52 cm |
|
Wavelength |
532 nm |
|
Range, z |
58.2 km |
|
Beacon Separation |
8 and 31 cm |
|
Turbulence Strength |
0.2, 1.0, and 5.0 x 10⁻¹⁷. No inner or outer scale. |
|
Phase Screens |
15 512x256 screens, grid spacing, dx = D/70, no low order mode correction. |
|
Propagation: |
256x256 grids in ACS, 512x256 in WaveTrain, grid spacing = D/70. Collimated wave optics propagation (planar reference wave). Filters applied in both spatial and spatial frequency domains. (for details, see discussion below) |
|
Extended Source Modeling: |
Uniformly illuminated 50 cm disk, radiating 1 W/sr/m2 on axis. 16 random speckle realizations, different for each atmospheric realization. |
Table 1, Simulation Parameters
Each speckle realization was generated as follows: To obtain the field amplitude, we took the square root of the source brightness pattern, then normalized it to take radiometrics into account. The normalization factor can be derived by considering how numerical propagation works in the case of a field mesh with a single nonzero mesh point: In the far field, the energy would be distributed uniformly over a rectangular angular region (l/dx) by (l/dy). Because we have chosen to specify the source brightness pattern in units of W/sr/m2, the intensity must be normalized by the solid angle, l2/(dx*dy), and the amplitude by l/sqrt(dx*dy). The phase is random, uniformly distributed between zero and two pi, and delta-correlated. We used sixteen speckle realizations to represent the source, dividing the source brightness equally among them, and generating a new set of speckle realizations for each atmosphere.
In the initial propagation, from the beacon to the first phase screen, a frequency domain filter was applied to limit the angular spread of the field. The exact form of the filter was a "raised cosine", unity in the center, zero at the edges, with a half cosine wave as transition. The full width of the nonzero region, expressed as an angle, was 1.5*nx*dx / z, while the width of the cosine transition regions on either side were 0.05*nx*dq, where dq = l / (nx*dx). After completing the propagation, a spatial domain filter, also a raised cosine, was applied. In this case, the full width of the nonzero region was 0.9*nx*dx, while the transition regions were .05*nx*dx. On the second and subsequent propagations a different frequency domain filter was used, where the width of the transition regions was unchanged, while the width of the nonzero region was 0.95*nx*dq. The same spatial domain filter was used in each propagation.
After each propagation, a phase screen was applied to the field. For each of the three turbulence strengths we generated one hundred Monte Carlo realizations of the atmosphere. In WaveTrain we assumed 100% transmittance, while in ACS we used 70%. This difference is unimportant because when comparing results between the two codes we will normalize by the average intensity.
Upon reaching the receiver plane, we applied a 52 cm aperture to the field, then propagated it to a focal plane. In WaveTrain we used a focal length of one meter, so that dimensions in the focal plane can be interpreted as either meters or radians. In ACS the angular resolution was half a microradian; in WaveTrain we used a quarter of a microradian, then down-sampled it. We accumulated the intensities from the sixteen speckle realizations to get the total power distribution on the focal plane, then, in WaveTrain, multiplied by the pulse length, one microsecond, to get the final image. We recorded a total of three hundred images with each code, one for each atmospheric realization.
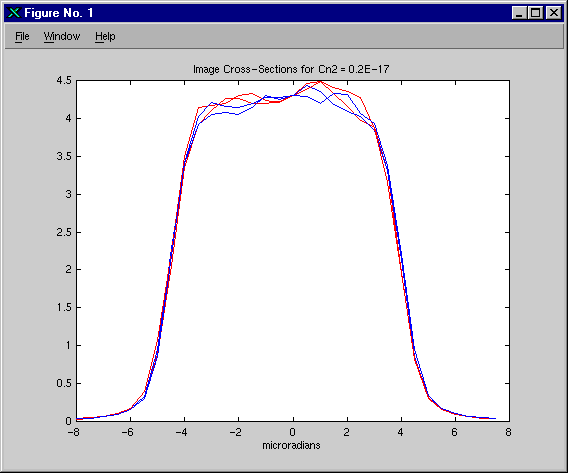
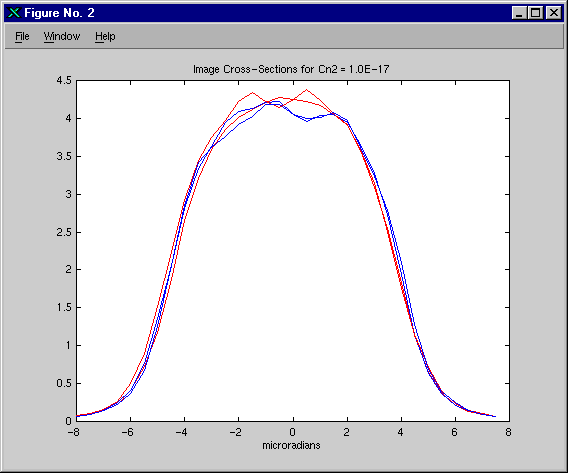
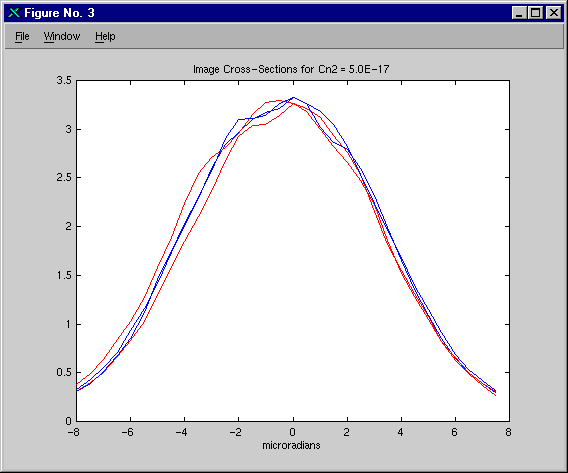
To compare results, we looked at the individual images from each code, and found them qualitatively indistinguishable. We compared the hundred-frame average images for each turbulence strength, and found them to be almost identical, as shown in Figures 1, 2, and 3. Apart from the issue of radiometrics, which we will address below, we conclude that WaveTrain is now well-anchored to ACS for modeling extended objects using multiple speckle realizations.


To anchor radiometrics, we will compute the total expected energy for a single image. The total energy is the product of the total power and the pulse length. The total power is the product of the solid angle subtended at the source by the receiver aperture and the total power per sterradian. The total power per sterradian is the integral of the brightness distribution, which in this case is just the the area of the source, since the brightness was assumed to be uniform with a value of 1 W/sr/m2. Thus the total expected energy per image is given by the following:
total energy = (1.0e-6 seconds) * (p*(50cm/2)2 W/sr) * (p*(52cm/58.2km/2)2 sr) = 1.23e-17 Joules
We then computed the total energy in each of the hundred-frame average images from WaveTrain, and obtained 1.18e-17, 1.16e-17, and 1.09e-17 Joules, for the low, medium, and high turbulence cases. The small differences from the expected value are due in part to the fact that because of pixelization the source is not exactly a circle, and in part to energy lost through filtering. The latter effect increases with increasing turbulence, as was observed.